
A Better Way to Measure Baseball Pitchers

Providing a simple breakdown of Grid WAR (Wins Above Replacement). An advance metric that reveals the true value of starting pitchers.
So let's say you're watching two baseball pitchers who both allow 15 runs over six games. Traditional stats would say they're equally valuable. But what if one pitcher threw five amazing games and one terrible game, while the other was just mediocre in every game? Which pitcher actually helped their team more?
This exact scenario reveals a massive flaw in how we've been measuring pitcher performance for decades. That’s why Grid WAR was created, and it changes how we understand pitcher value.
Traditional Pitcher Stats
The Gold Standard: Wins Above Replacement (WAR) is, right now, the ultimate stat for measuring how much a player contributes to their team's success. Think of it as asking: "How many more games would this team win with this player versus a replacement-level player (someone you could easily find to fill the spot)?
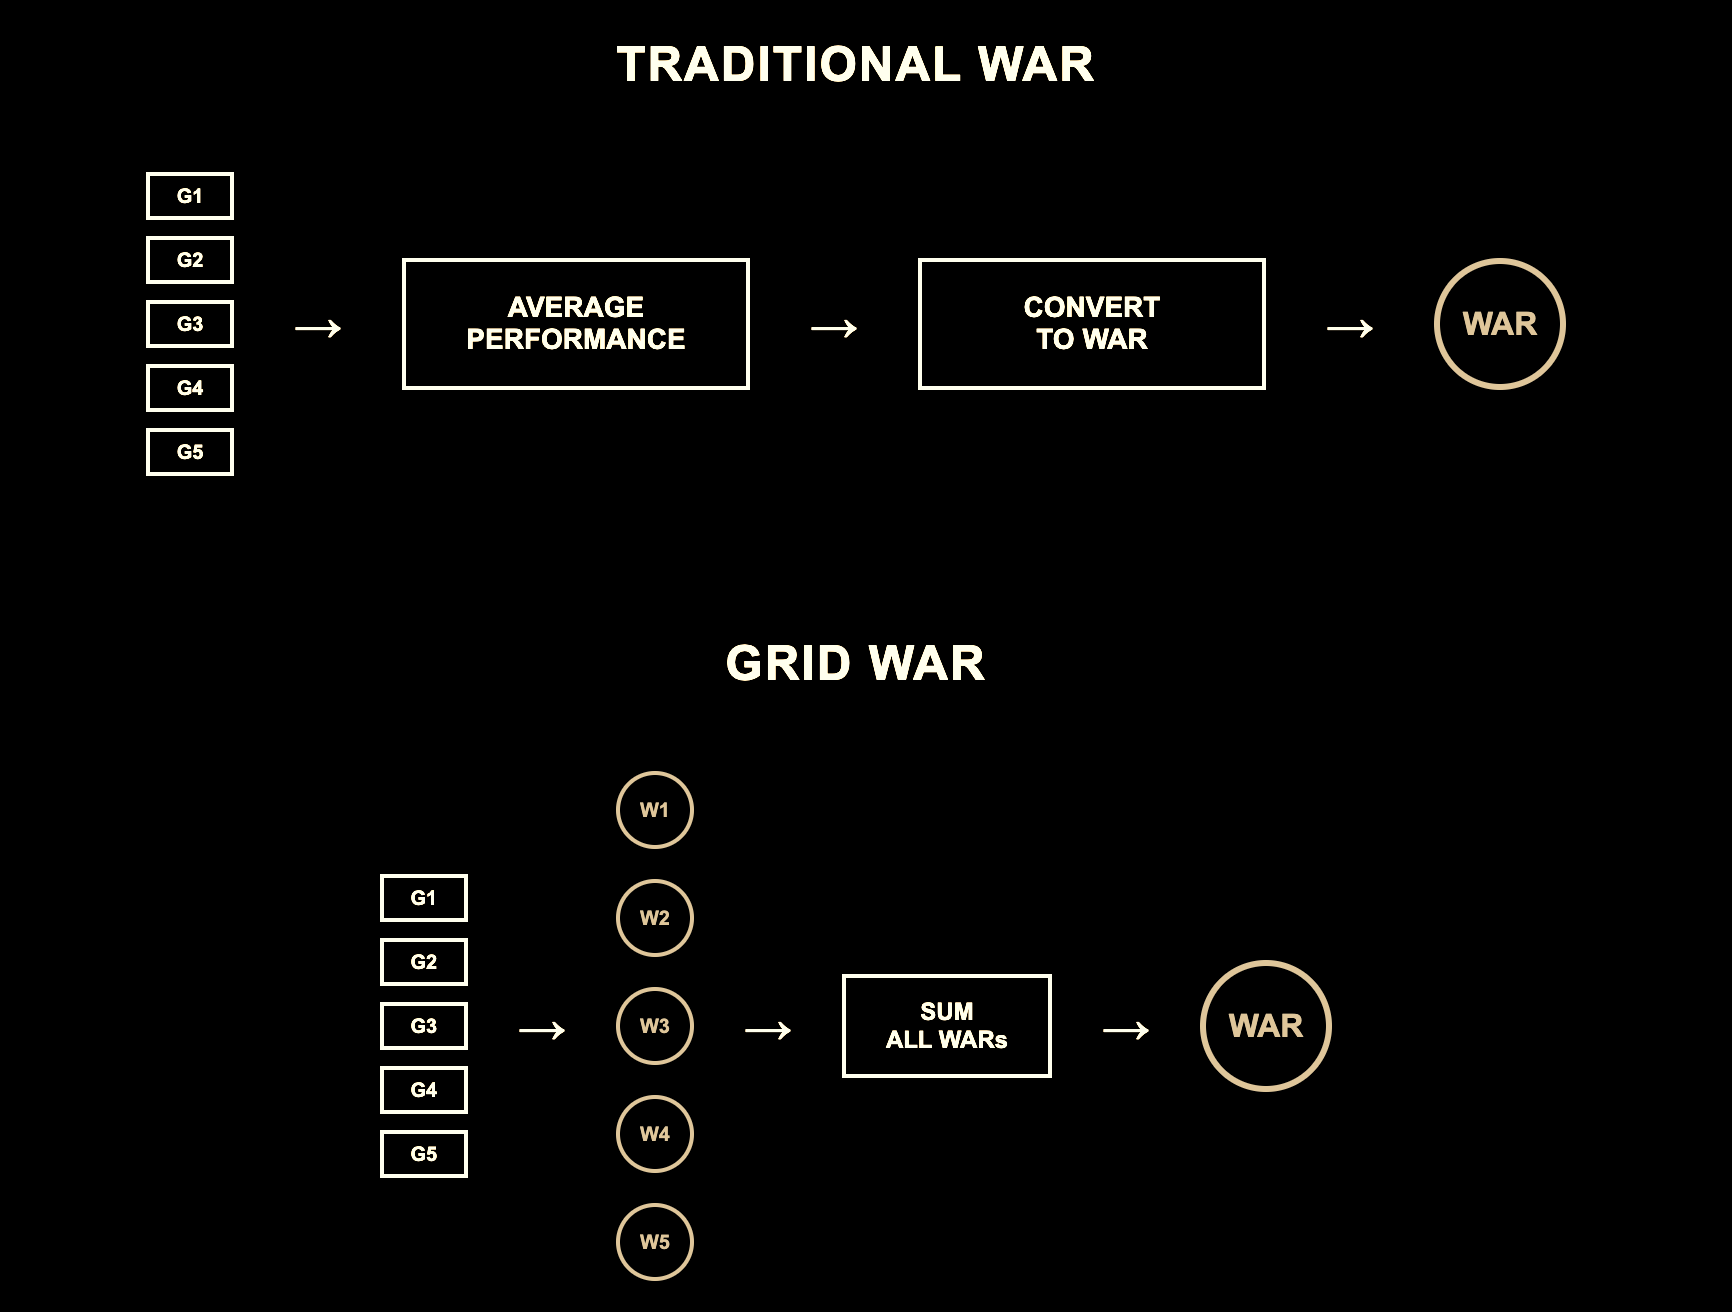
For decades, baseball analysts have calculated WAR by:
- Averaging a pitcher's performance across an entire season
- Converting that average into estimated wins
But here's the critical flaw: averaging pitcher performance treats all runs the same, when they're actually not.

Let's look at Max Scherzer for example:
His six-game stretch in 2014:
Games 1-5: Excellent performance (1.2 ERA over 37 innings)
- Traditional WAR: About 2.0
- Team record: Won all 5 games
Game 6: Complete disaster (10 runs in 4 innings)
- Combined traditional WAR: Drops to 0.5
- This makes no sense: You can't lose a game more than once!
The averaging method penalizes great pitchers for bad games far more than it should. Scherzer's "real" WAR should be about 1.5 (his 2.0 from great games minus 0.4 for the disaster), not 0.5.
Here's the key: You can only lose a baseball game once.
When a pitcher allows 8 runs instead of 7 runs in a blowout loss, it doesn't make the loss "more lost." But traditional WAR treats every run equally, allowing one bad game to count as multiple losses.
Introducing Grid WAR: The Game-by-Game Solution
Grid WAR (GWAR) fixes this by calculating WAR for each individual game, then adding them up. Instead of averaging performance then calculating WAR, it calculates WAR then adds the totals.
Here's the principle behind why this works better:
How Grid WAR Works Under The Hood
Step 1: Build the Lookup Table
- Create a chart that shows: "If a pitcher allows X runs in Y innings, his team has Z% chance to win"
- Make different charts for different ballparks (Coors Field vs. normal stadiums)
Step 2: Score Each Individual Game
- Look at what the pitcher did in one specific game
- Check the chart: "How much did this help the team win?"
- Compare to what a mediocre replacement pitcher would have done
Step 3: Add Up All the Games
- Take every single game score and add them together
- Don't average anything — just pure addition
- One great game can't be ruined by one terrible game
How The Math Of This Breaks Down
The researchers used something called a Poisson model to estimate win probabilities.
Think of a Poisson model like predicting how many cars will drive past your house in an hour.
In baseball terms:
- It predicts how many runs teams will score in each inning
- It knows that most innings = 0 runs, some innings = 1-2 runs, very few innings = 3+ runs
- It's like having a "runs per inning calculator" that works for any situation
Why this matters:
- Instead of just guessing win probability, researchers used math to predict it accurately
- The model creates a giant spreadsheet: "2 runs through 7 innings = 73% win chance"
- This makes Grid WAR based on real math, not just opinions
It Literally Changes Everything..

The Convexity Principle
Convexity: damage that gets smaller as things get worse
Think of it like a video game health bar:
- Going from 100% health to 90% health = Problem (you might die)
- Going from 20% health to 10% health = You're already basically dead anyway
In baseball terms: Grid WAR reveals something crucial: each additional run hurts less when you're already getting blown out.
Real examples:
- Allowing 2 runs instead of 1 run: Huge impact on win probability (might lose a close game)
- Allowing 8 runs instead of 7 runs: Minimal additional impact (game was already over)
The Problem with Traditional Stats: Traditional metrics treat both scenarios equally.
The most dramatic example: Sandy Koufax's 1966 season
- Traditional ranking: 20th best season ever (FanGraphs FIP WAR)
- Grid WAR ranking: Best season of all time
Why the difference? Koufax had incredible games (17 complete games allowing ≤1 run) mixed with three terrible "blow-up" games. Traditional metrics let those three bad games destroy the value of his dominant performances. Grid WAR properly recognizes that you can't lose those games more than once.
What This Reveals About Talent
The data shows that:
- All pitchers throw great games sometimes
- Great pitchers throw fewer terrible games
- Mediocre pitchers get unfairly penalized when their occasional great games are diluted by their disasters
Historical Re-evaluations
Biggest Winners Under Grid WAR:
- Whitey Ford: Jumps from 49th to 19th best pitcher since 1952
- Catfish Hunter: Jumps from 107th to 32nd best pitcher since 1952
- Yovani Gallardo: Consistently undervalued due to high variance
Why the Changes: These pitchers had extreme "boom-bust" patterns that traditional metrics punished too harshly.
Modern Implications For Teams:
- Better evaluation of pitcher trades and contracts
- Understanding that some variance is skill, not luck
- Properly valuing pitchers who excel in high-leverage situations
For the "Opener" Strategy: Grid WAR provides mathematical justification for using elite relievers as opening pitchers rather than closers, since every inning of a game matters for the outcome.

The Data Behind the Model
The researchers analyzed:
- Every pitch from 1990-2020 in their database
- Focused on 2010-2019 for main analysis
- Controlled for ballpark effects, opposing team strength, and season differences
What Grid WAR Doesn't Account For (Yet)
- Opposing batter quality: Doesn't adjust for facing stronger/weaker lineups
- Team fielding quality: Doesn't separate pitcher performance from defensive support
- Within-game strategy: Doesn't account for intentional pitching decisions
Why These Limitations Don't Break the Model
The researchers argue these factors have smaller impacts than the core innovation of game-by-game calculation. The dramatic improvements in historical accuracy and predictive power suggest the benefits far outweigh these limitations.
What This Means for You..
Whether you're a:
- Fan: Better understanding of pitcher value and historical greatness
- Fantasy player: More accurate evaluation of pitcher performance
- Analyst: Superior predictive tool for future performance
- Team executive: Better framework for personnel decisions
Grid WAR provides a more accurate lens for understanding one of baseball's most important positions.
The Future of Pitcher Evaluation
This research represents more than just a new statistic, it's a fundamental rethinking of how we measure performance in contexts where the impact of mistakes isn't linear.
The principle extends beyond baseball: any field where "you can only lose once" but traditional metrics treat all failures equally might benefit from similar game-by-game analysis approaches.
As teams adopt Grid WAR for decision-making, we'll likely see:
- More accurate player valuations
- Better understanding of risk vs. reward in pitcher acquisition
- Fairer evaluation of historically undervalued pitchers
The era of letting one bad game count as multiple losses is finally ending.
Grid WAR is publicly available at gridwar.xyz, where you can explore every starting pitcher's game-by-game performance since 1952. The complete research and methodology are detailed in the original academic paper by Brill, Liu, and Wyner.